Microsoft Fabric is an end-to-end, software-as-a-service (SaaS) platform for data analytics. It is built around a data lake called OneLake, and brings together new and existing components from Microsoft Power BI, Azure Synapse, and Azure Data Factory into a single integrated environment.
Microsoft Fabric encompasses data movement, data storage, data engineering, data integration, data science, real-time analytics, and business intelligence, along with data security, governance, and compliance. In many ways, Fabric is Microsoft’s answer to Google Cloud Dataplex. As of this writing, Fabric is in preview.
Microsoft Fabric is targeted at, well, everyone: administrators, developers, data engineers, data scientists, data analysts, business analysts, and managers. Currently, Microsoft Fabric is enabled by default for all Power BI tenants.
Microsoft Fabric Data Engineering combines Apache Spark with Data Factory, allowing notebooks and Spark jobs to be scheduled and orchestrated. Fabric Data Factory combines Power Query with the scale and power of Azure Data Factory, and supports over 200 data connectors. Fabric Data Science integrates with Azure Machine Learning, which allows experiment tracking and model registry. Fabric Real-Time Analytics includes an event stream, a KQL (Kusto Query Language) database, and a KQL queryset to run queries, view query results, and customize query results on data. If KQL is new to you, welcome to the club.
 IDG
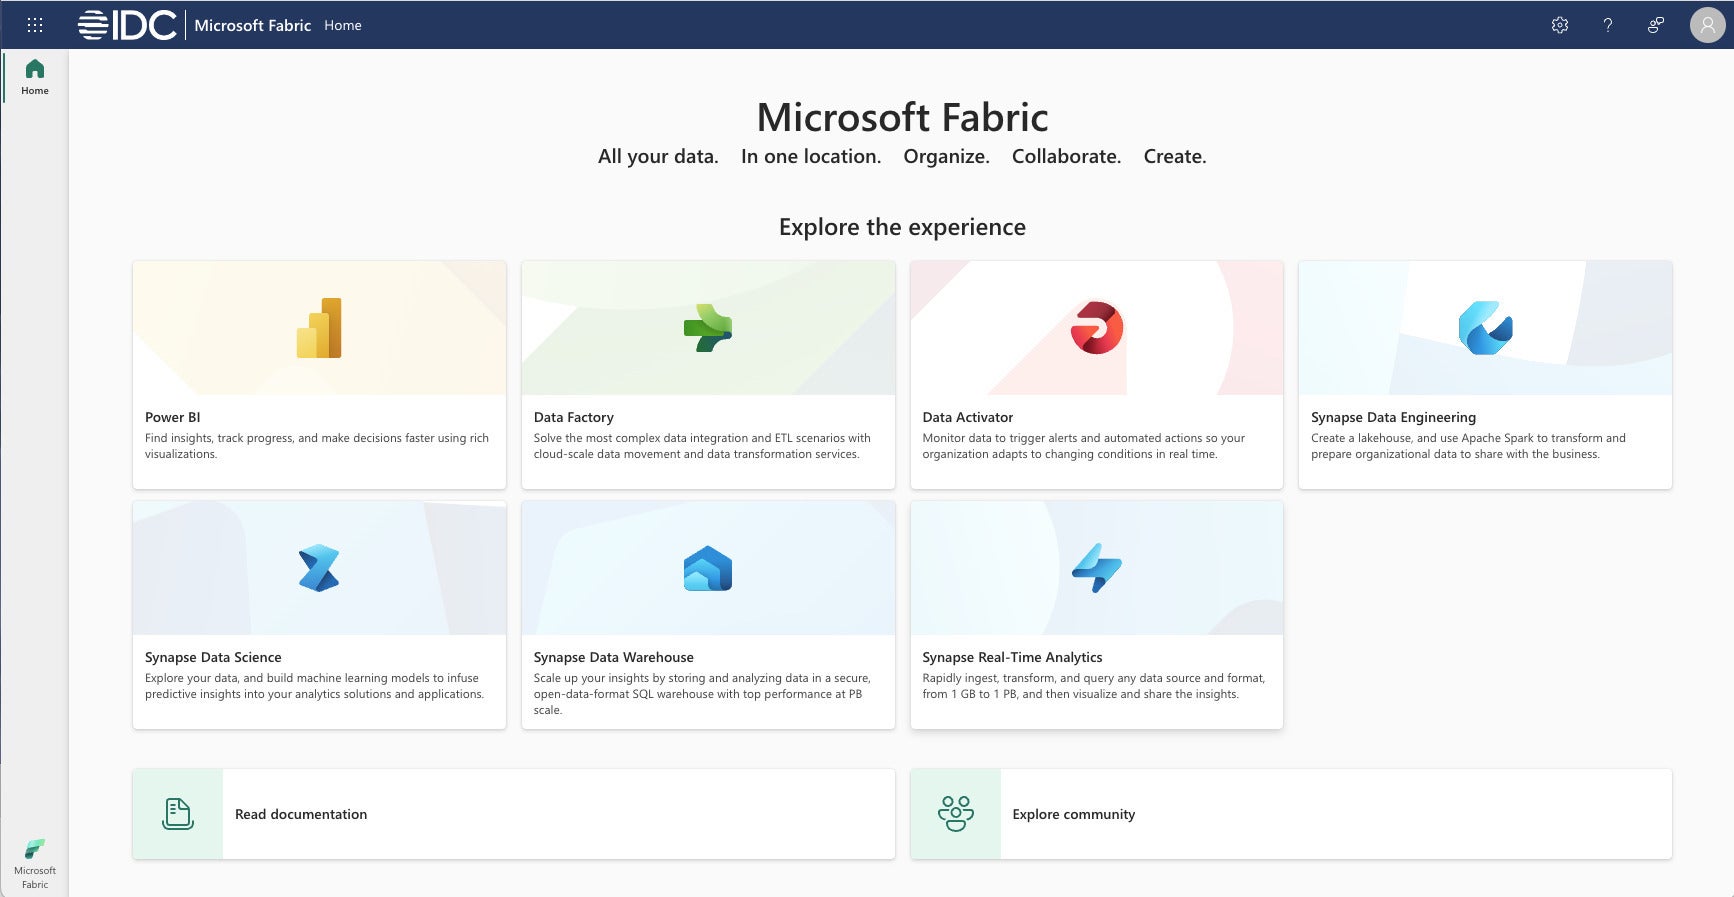
IDGMicrosoft Fabric home screen. Note the links to Power BI, Data Factory, Data Activator, Synapse Data Engineering, Synapse Data Science, Synapse Data Warehouse, and Synapse Real-Time Analytics.
OneLake
OneLake is a unified, logical data lake for your whole organization; every tenant has one and only one data lake. OneLake is designed to be the single place for all your analytics data, much in the same way as Microsoft wants you to use OneDrive for all your files. To simplify using OneLake from your desktop, you can install OneLake file explorer for Windows.
OneLake is built on Azure Data Lake Storage (ADLS) Gen2 and can support any type of file. However, all Fabric data components, such as data warehouses and data lakehouses, store their data automatically in OneLake in Delta format (based on Apache Parquet), which is also the storage format used by Azure Databricks. It doesn’t matter whether the data was generated by Spark or SQL, it still goes into a single data lake in Delta format.
Creating a OneLake data lakehouse is fairly straightforward: Switch to the Data Engineering view, create and name a new lakehouse, and upload some CSV files to the file portion of the data lake.
 IDG
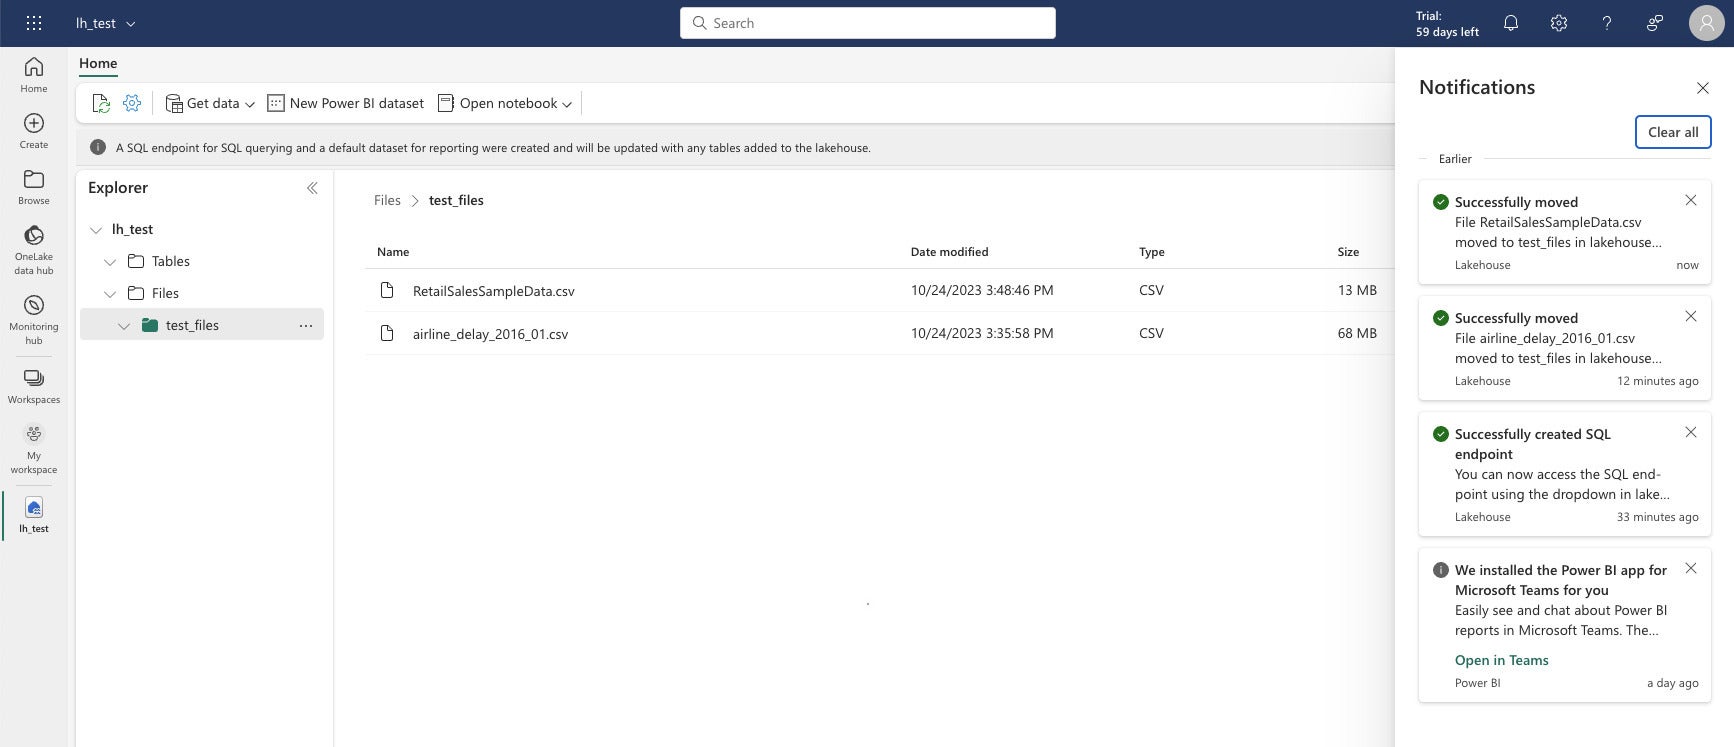
IDGIn the data engineering view of Microsoft Fabric, you can see your files and tables. Tables are in Delta Parquet format. When you select a file, you get a three-dot menu for performing operations on that file, for example loading it into a table.
Getting from there to having tables in the lakehouse can (currently) be more work than you might expect. You would think that the Load to Tables pop-up menu item would do the job, but it failed for my initial tests. I eventually discovered, with help from Microsoft Support, that the Load to Tables function doesn’t (as of this writing) know how to handle column titles with embedded spaces. Ouch. All the competing lakehouses handle that without a hitch, but Fabric is still in preview. I am assured that this capability will be added in the released product.
I did get that conversion to work with cleaned-up CSV files. I was also able to run a Spark SQL query in a notebook against a new table.
 IDG
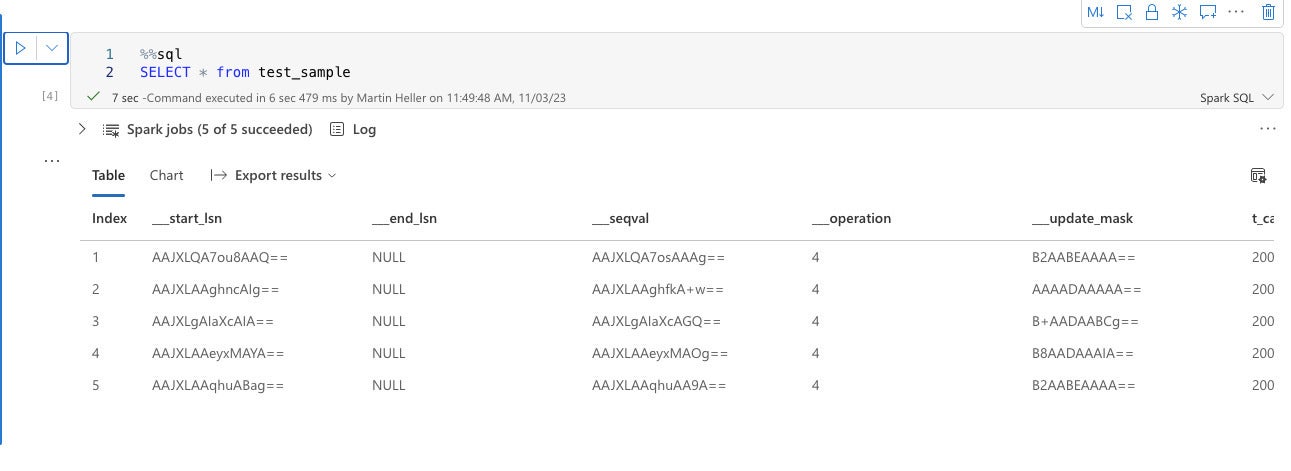
IDGFabric notebooks support both Python and SQL. Here we are using Spark SQL to display the contents of a OneLake lakehouse table.
Spark isn’t the only way to run SQL queries against the lakehouse tables. You can access any Delta-format table on OneLake via a SQL endpoint, which is created automatically when you deploy the lakehouse. A SQL endpoint references the same physical copy of the Delta table on OneLake and offers a T-SQL experience. It’s basically using Azure SQL rather than Spark SQL.
As you’ll see later, OneLake can host Synapse Data Warehouses as well as lakehouses. Data warehouses are best for users with T-SQL skills, although Spark users can also read data in warehouses. You can create shortcuts in OneLake so that lakehouses and data warehouses can access tables without duplicating data.
Power BI
Power BI has been expanded to be able to work with OneLake lakehouse (Delta) tables. As always, Power BI can perform basic business intelligence data analysis and report generation, and integrate with Microsoft 365.
 IDG
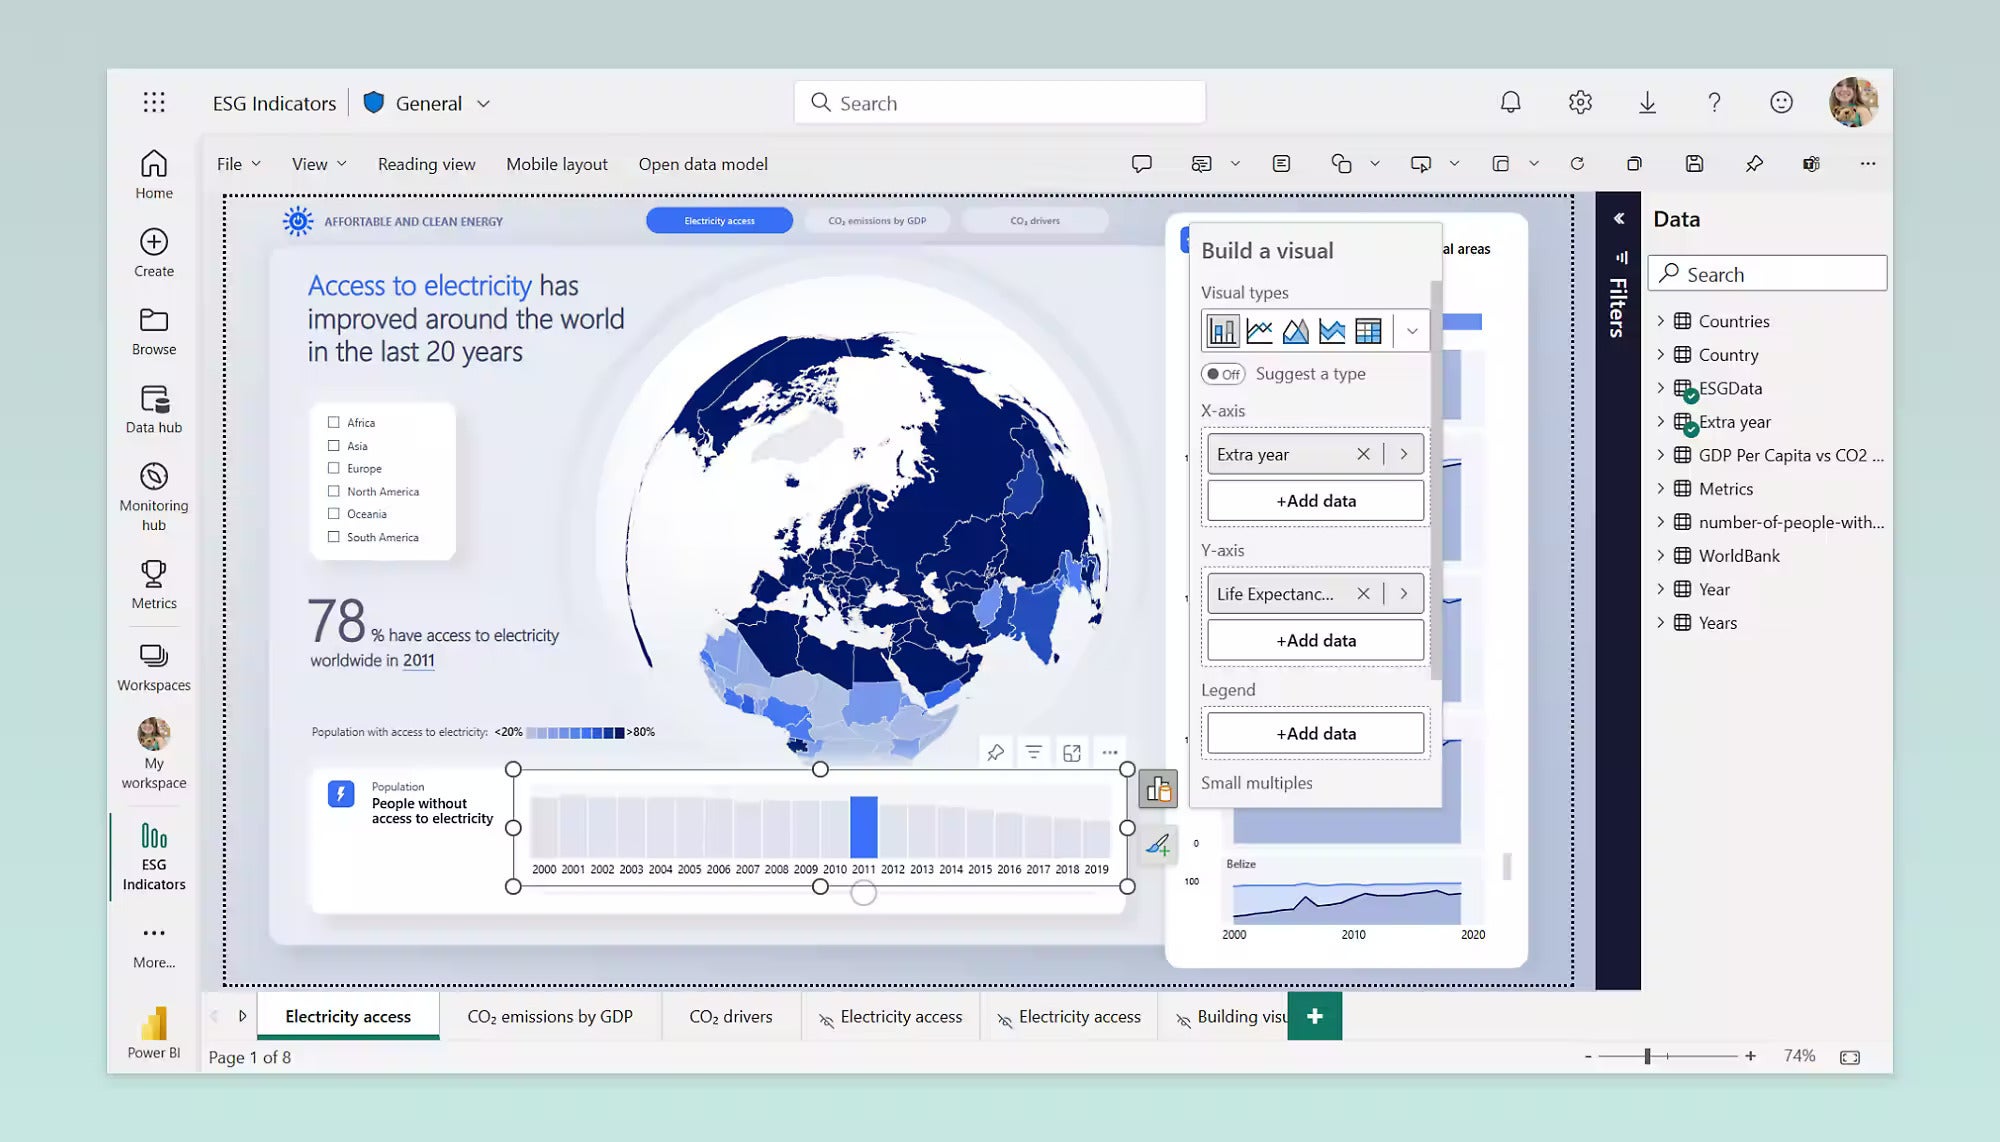
IDGA Power BI report within Microsoft Fabric. Pretty much all the important features of Power BI have been carried over into Fabric.
Data Factory
Data Factory in Microsoft Fabric combines citizen data integration and pro data integration capabilities. It connects to some 100 relational and non-relational databases, lakehouses, data warehouses, and generic interfaces. You can import data with dataflows, which allow large-scale data transformations with some 300 transformations, use the Power Query editor, and apply Power Query’s Data Extraction By Example.
I tried a dataflow that imported and transformed two tables from the Northwind dataset. I was impressed with the capabilities until the final publishing step failed. OK, it’s in preview.
You can also use data pipelines to create data orchestration workflows that bring together tasks like data extraction, loading into preferred data stores, notebook execution, and SQL script execution. I successfully imported two sample datasets, Public Holidays and NY Taxi rides, and saved them into data lakes. I didn’t test the capability to update the pipeline periodically.
If you need to load on-premises data into OneLake, you will eventually be able to create an on-premises data gateway and connect that to a dataflow. As a temporary workaround, you can copy your on-prem data to the cloud and load it from there.
Data Activator
According to Microsoft, Data Activator is a no-code experience in Microsoft Fabric for automatically taking actions when patterns or conditions are detected in changing data. It monitors data in Power BI reports and Eventstreams items, for when the data hits certain thresholds or matches other patterns. It then automatically takes appropriate action such as alerting users or kicking off Power Automate workflows.
Typical use cases for Data Activator include running ads when same-store sales decline, alerting store managers to move food from failing grocery store freezers before it spoils, and alerting account teams when customers fall into arrears, with customized time or value limits per customer.
Data Engineering
Most of what I discussed in the OneLake section above actually falls under data engineering. Data Engineering in Microsoft Fabric includes the lakehouse, Apache Spark job definitions, notebooks (in Python, R, Scala, and SQL), and data pipelines (discussed in the Data Factory section above).
Data Science
Data Science in Microsoft Fabric includes machine learning models, experiments, and notebooks. It has about half a dozen sample notebooks. I chose to run the time series forecasting model sample, which uses Python, the Prophet library (from Facebook), MLflow, and the Fabric Autologging feature. The time series forecasting sample uses the NYC Property Sales data dataset, which you download and then upload to a data lakehouse.
Prophet uses a traditional seasonality model for time series prediction, a refreshing departure from the trend towards increasingly complicated machine learning and deep learning models. The total run time for the fitting and predictions was 147 seconds, not quite three minutes.
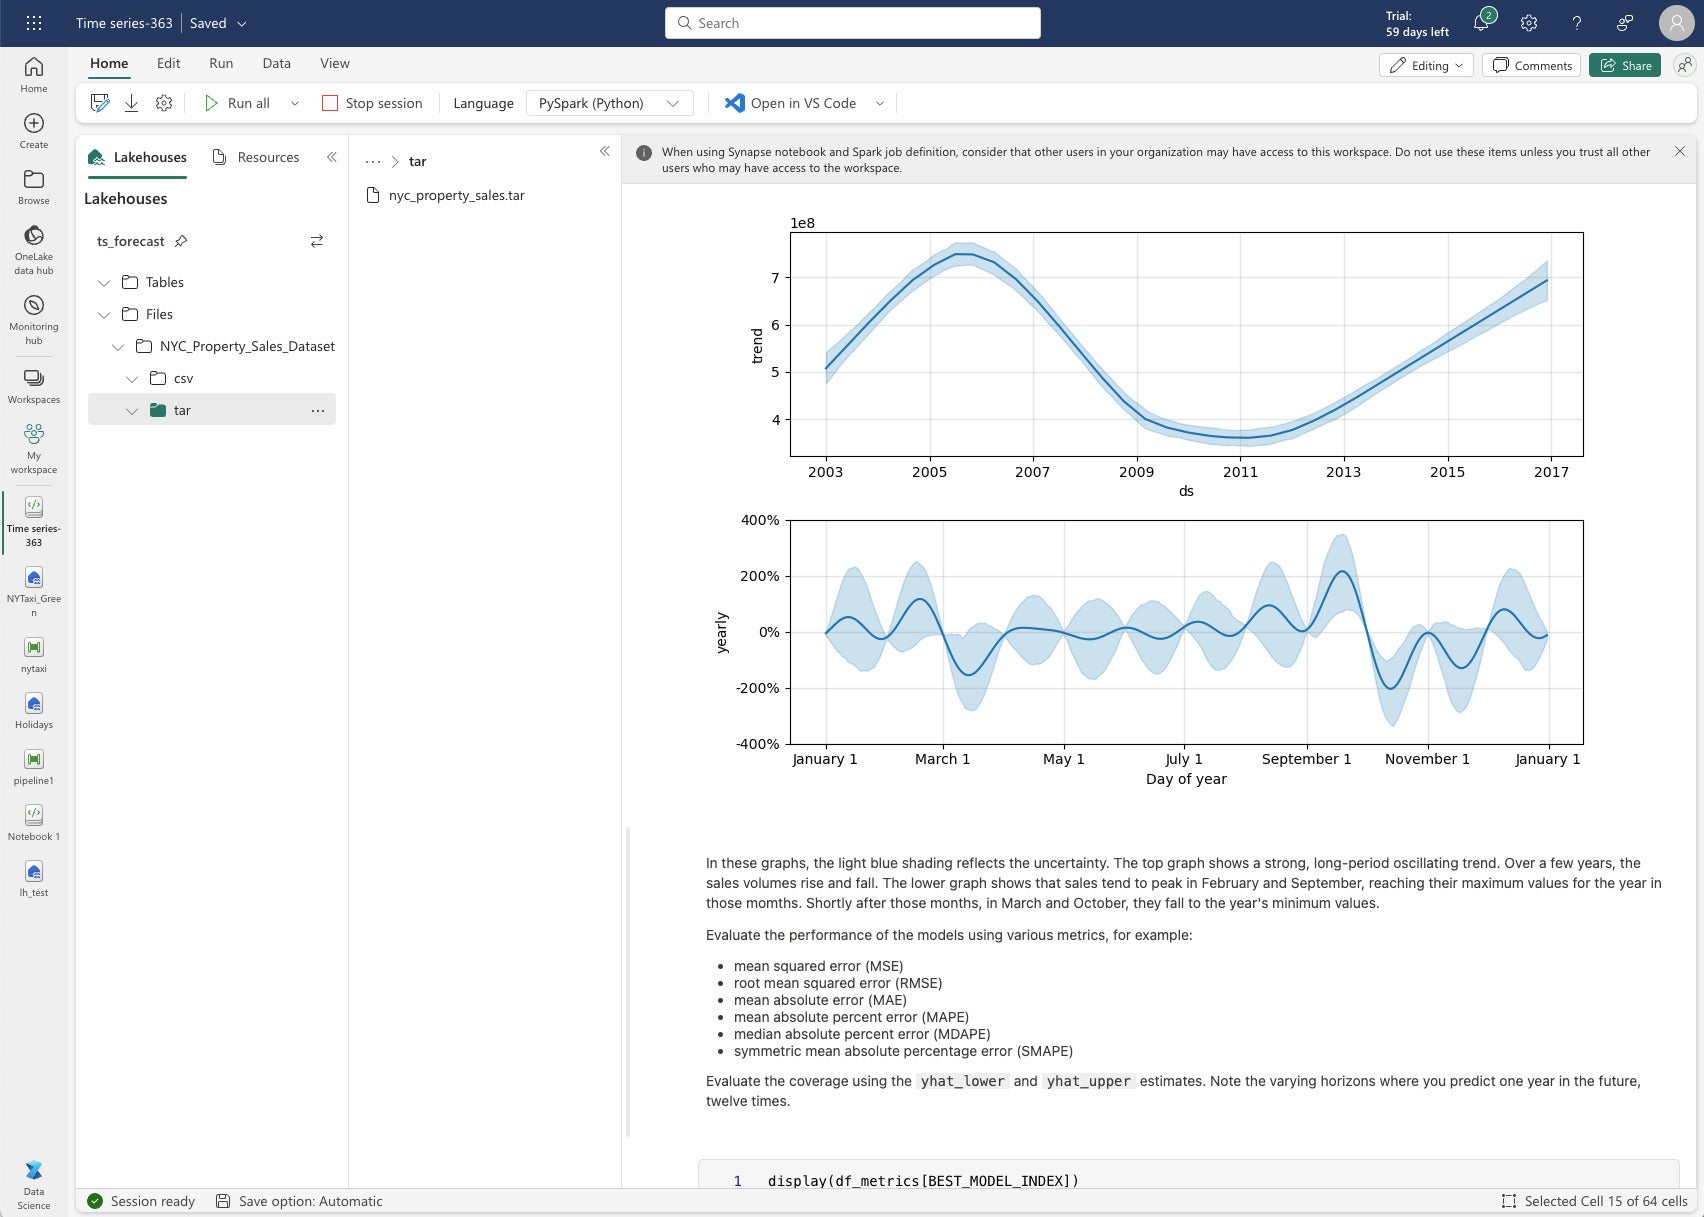 IDG
IDGPrediction of property sales after fitting NYC property sales data to a Prophet seasonality model.
Data Warehouse
Data Warehouse in Microsoft Fabric aims to converge the worlds of the data lakes and data warehouses. It’s not the same as the SQL Endpoint of the lakehouse: The SQL Endpoint is a read-only warehouse that is automatically generated upon creation from a lakehouse in Microsoft Fabric, while the Data Warehouse is a “traditional” data warehouse, meaning it supports the full transactional T-SQL capabilities like any enterprise data warehouse.
As opposed to the SQL Endpoint, where tables and data are automatically created, Data Warehouse puts you fully in control of creating tables and loading, transforming, and querying your data in the data warehouse using either the Microsoft Fabric portal or T-SQL commands.
I created a new warehouse and loaded it with Microsoft-provided sample data. That turns out to be another taxi trip dataset (from a different year), but this time factored into warehouse tables. Microsoft also provides some sample SQL scripts.
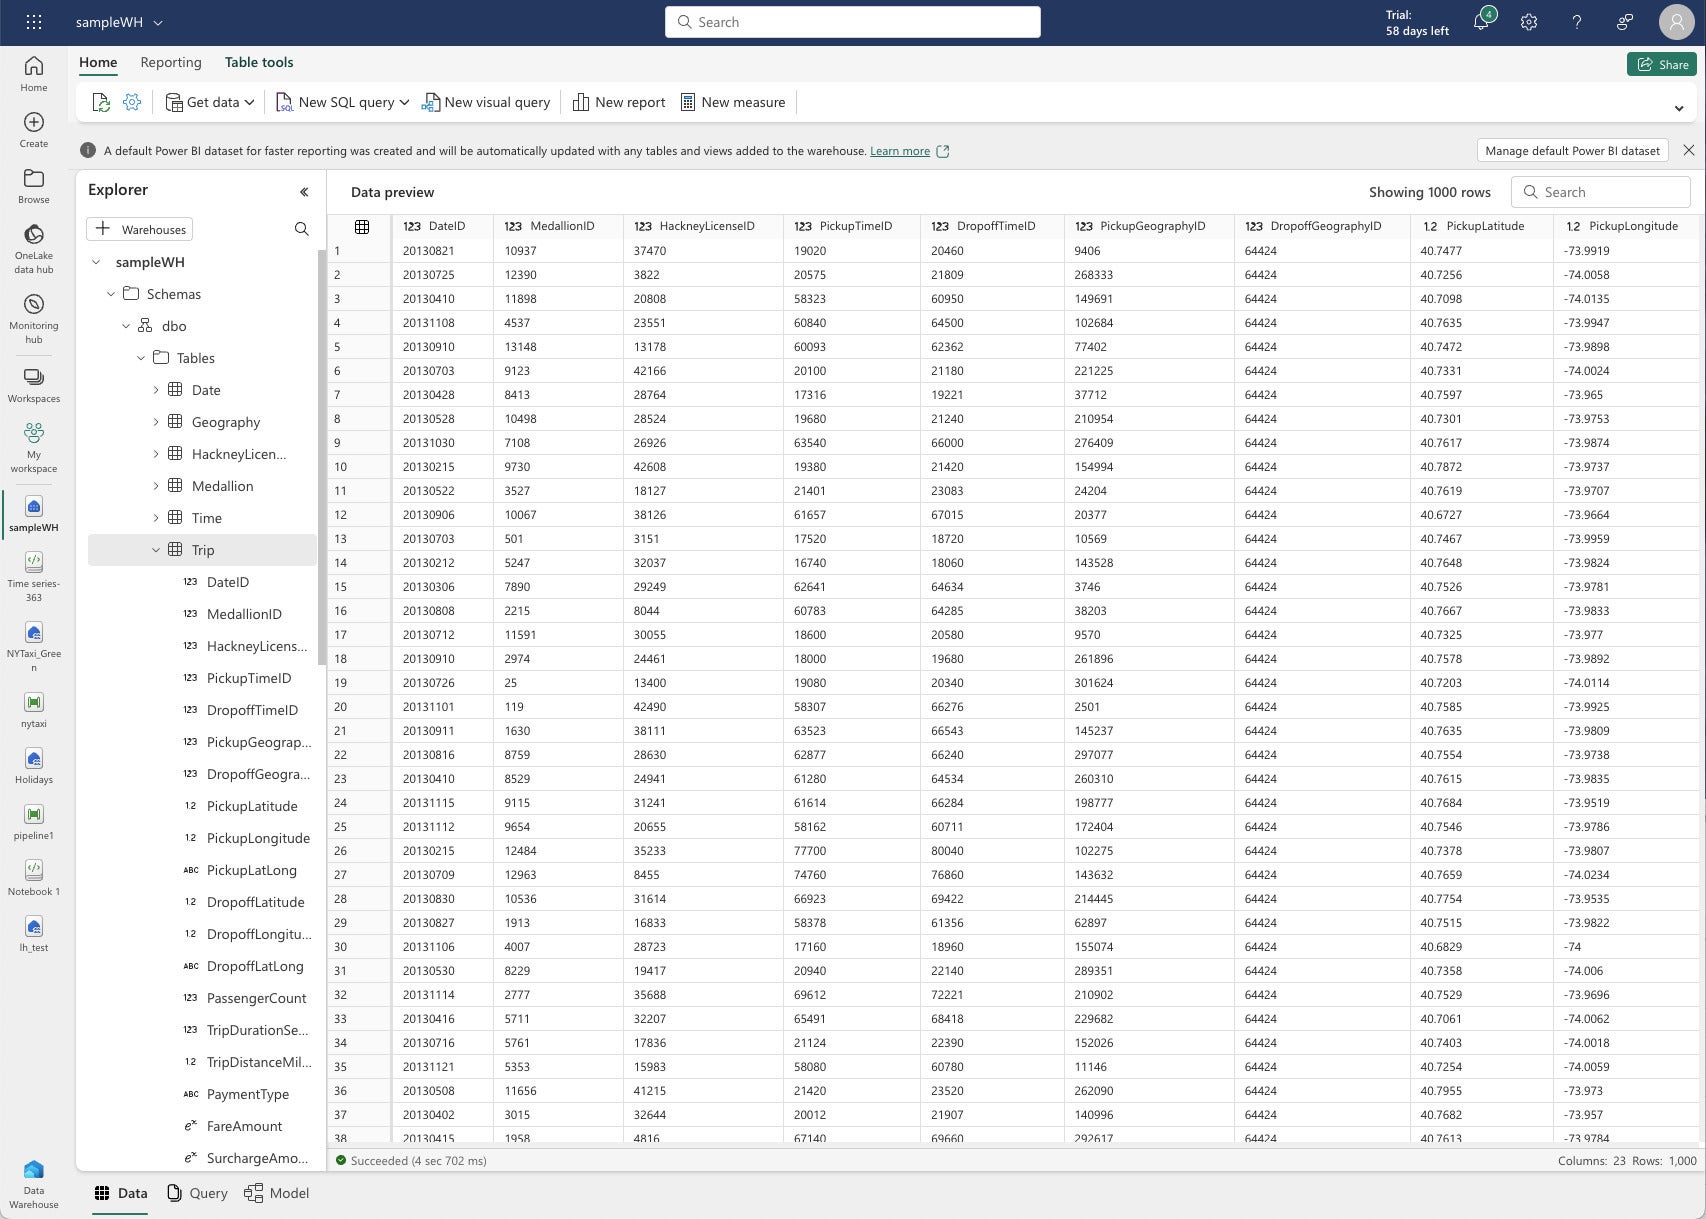 IDG
IDGFabric Data Warehouse data preview for one table. Note the messages about the automatically created Power BI dataset at the top.
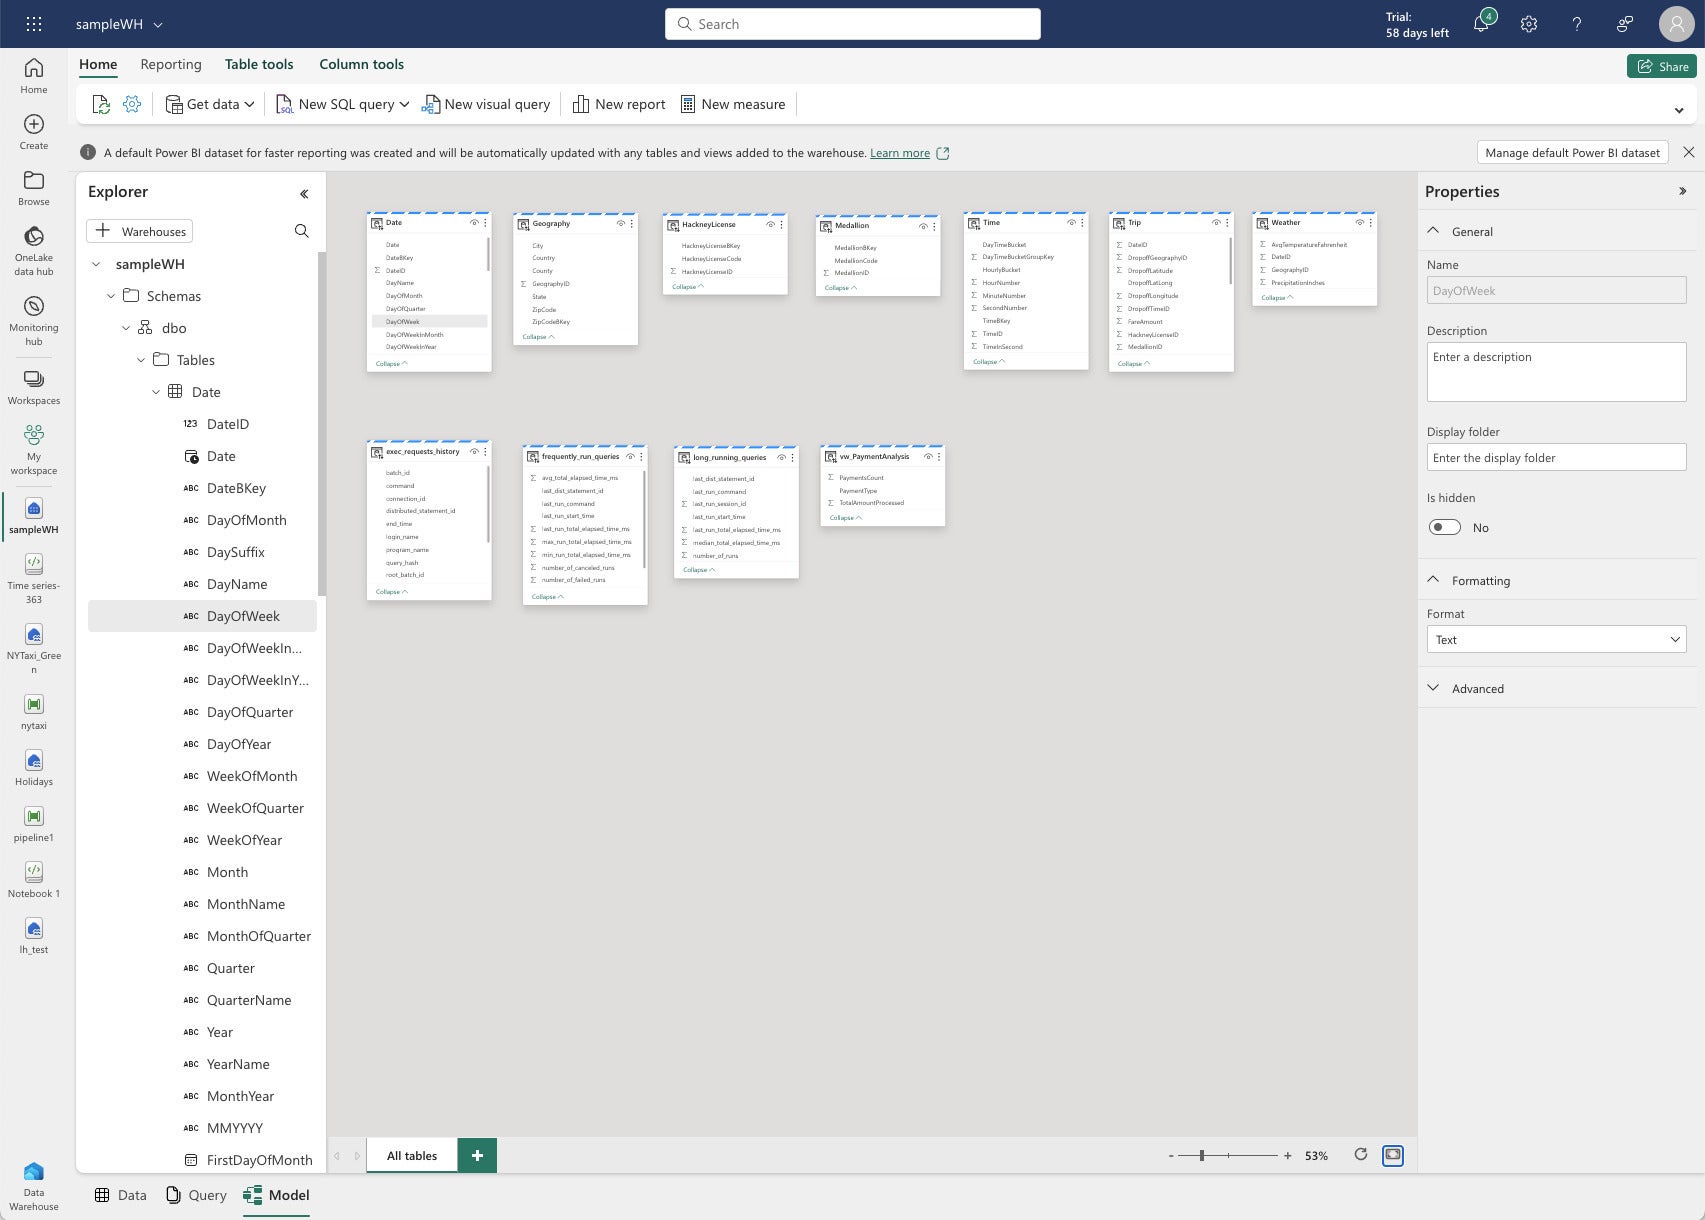 IDG
IDGFabric Data Warehouse model view.
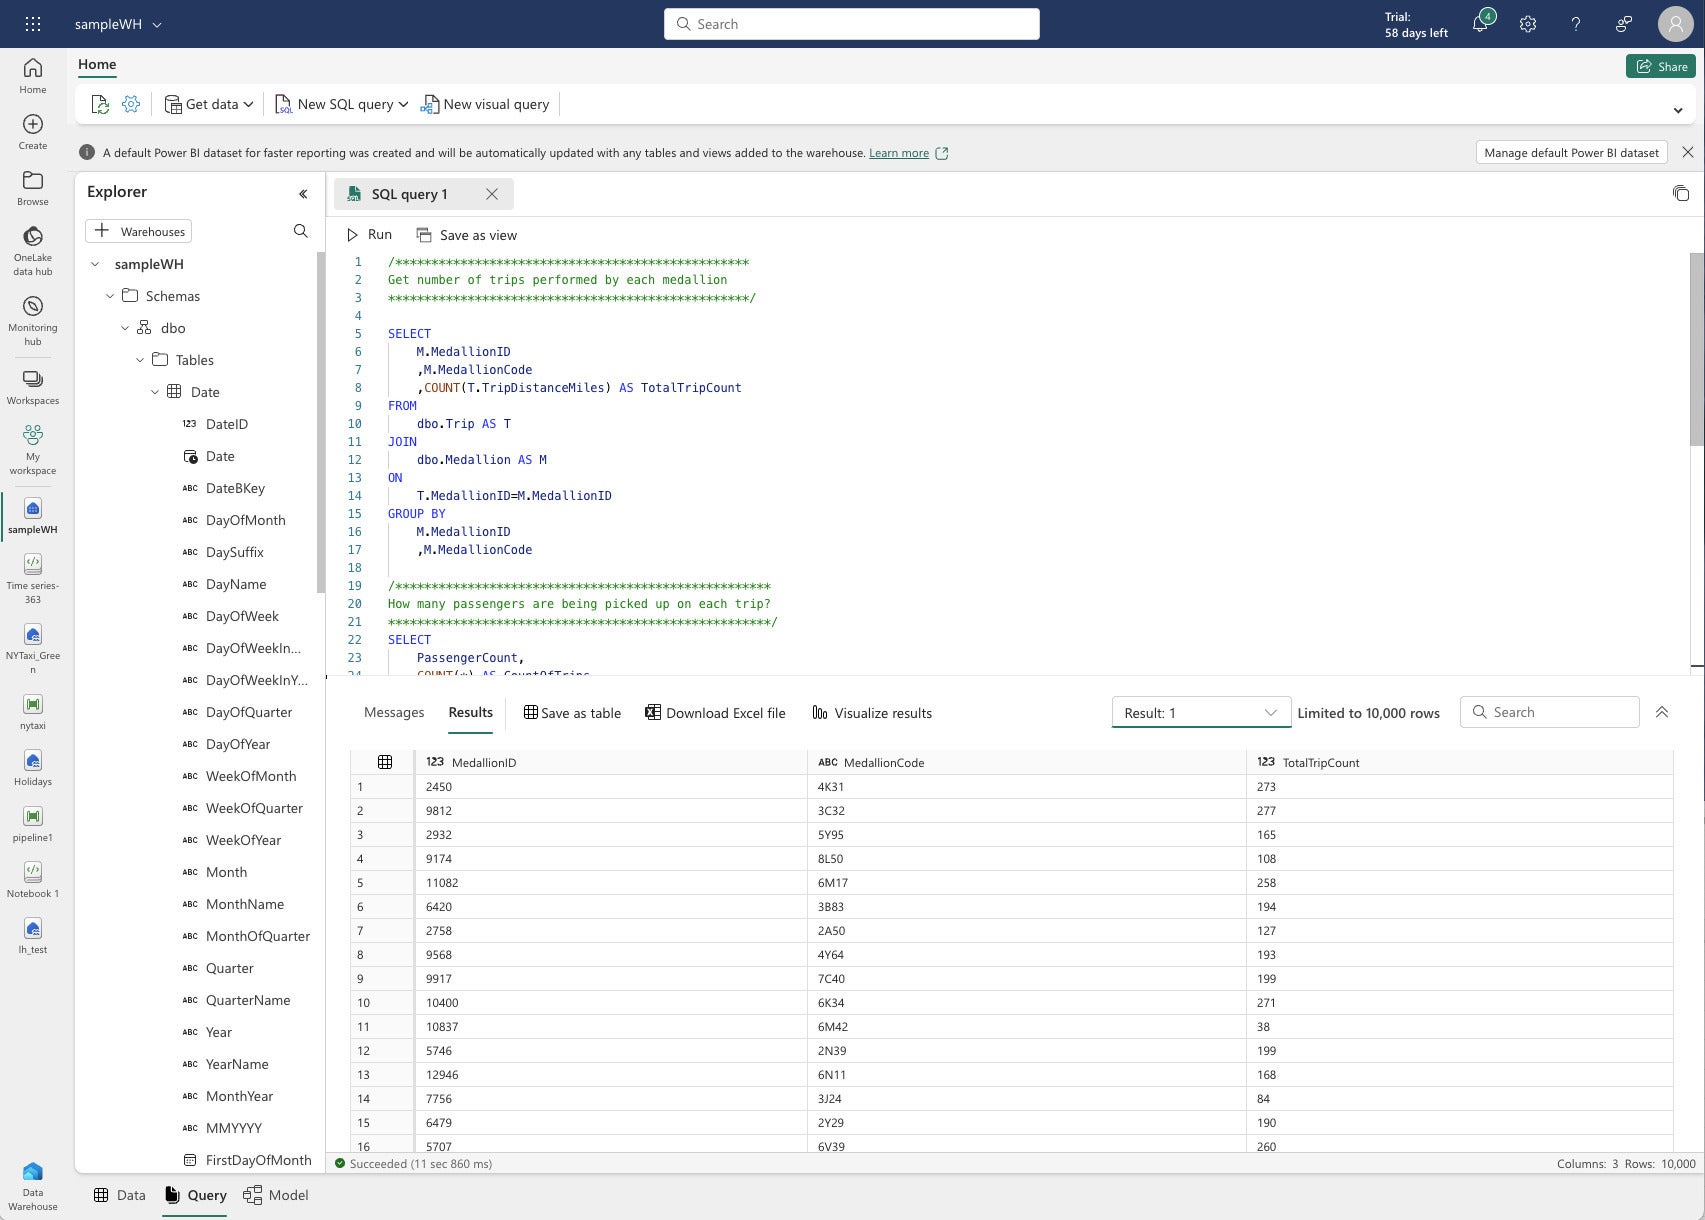 IDG
IDGFabric Data Warehouse query view. Microsoft supplied the SQL script as part of the sample.
Real-Time Analytics
Real-Time Analytics in Microsoft Fabric is closely related to Azure Data Explorer, so closely that the documentation links for Real-Time Analytics currently go to Azure Data Explorer documentation. I have been assured that the actual Fabric documentation is being updated.
Real-Time Analytics and Azure Data Explorer use Kusto Query Language (KQL) databases and queries. Querying data in Kusto is much faster than the transactional RDBMS, such as SQL Server, especially when the data size grows to billions of rows. Kusto is named after Jacques Cousteau, the French undersea explorer.
I used a Microsoft sample, weather analytics, to explore KQL and Real-Time Analytics. That sample includes a script with several KQL queries.
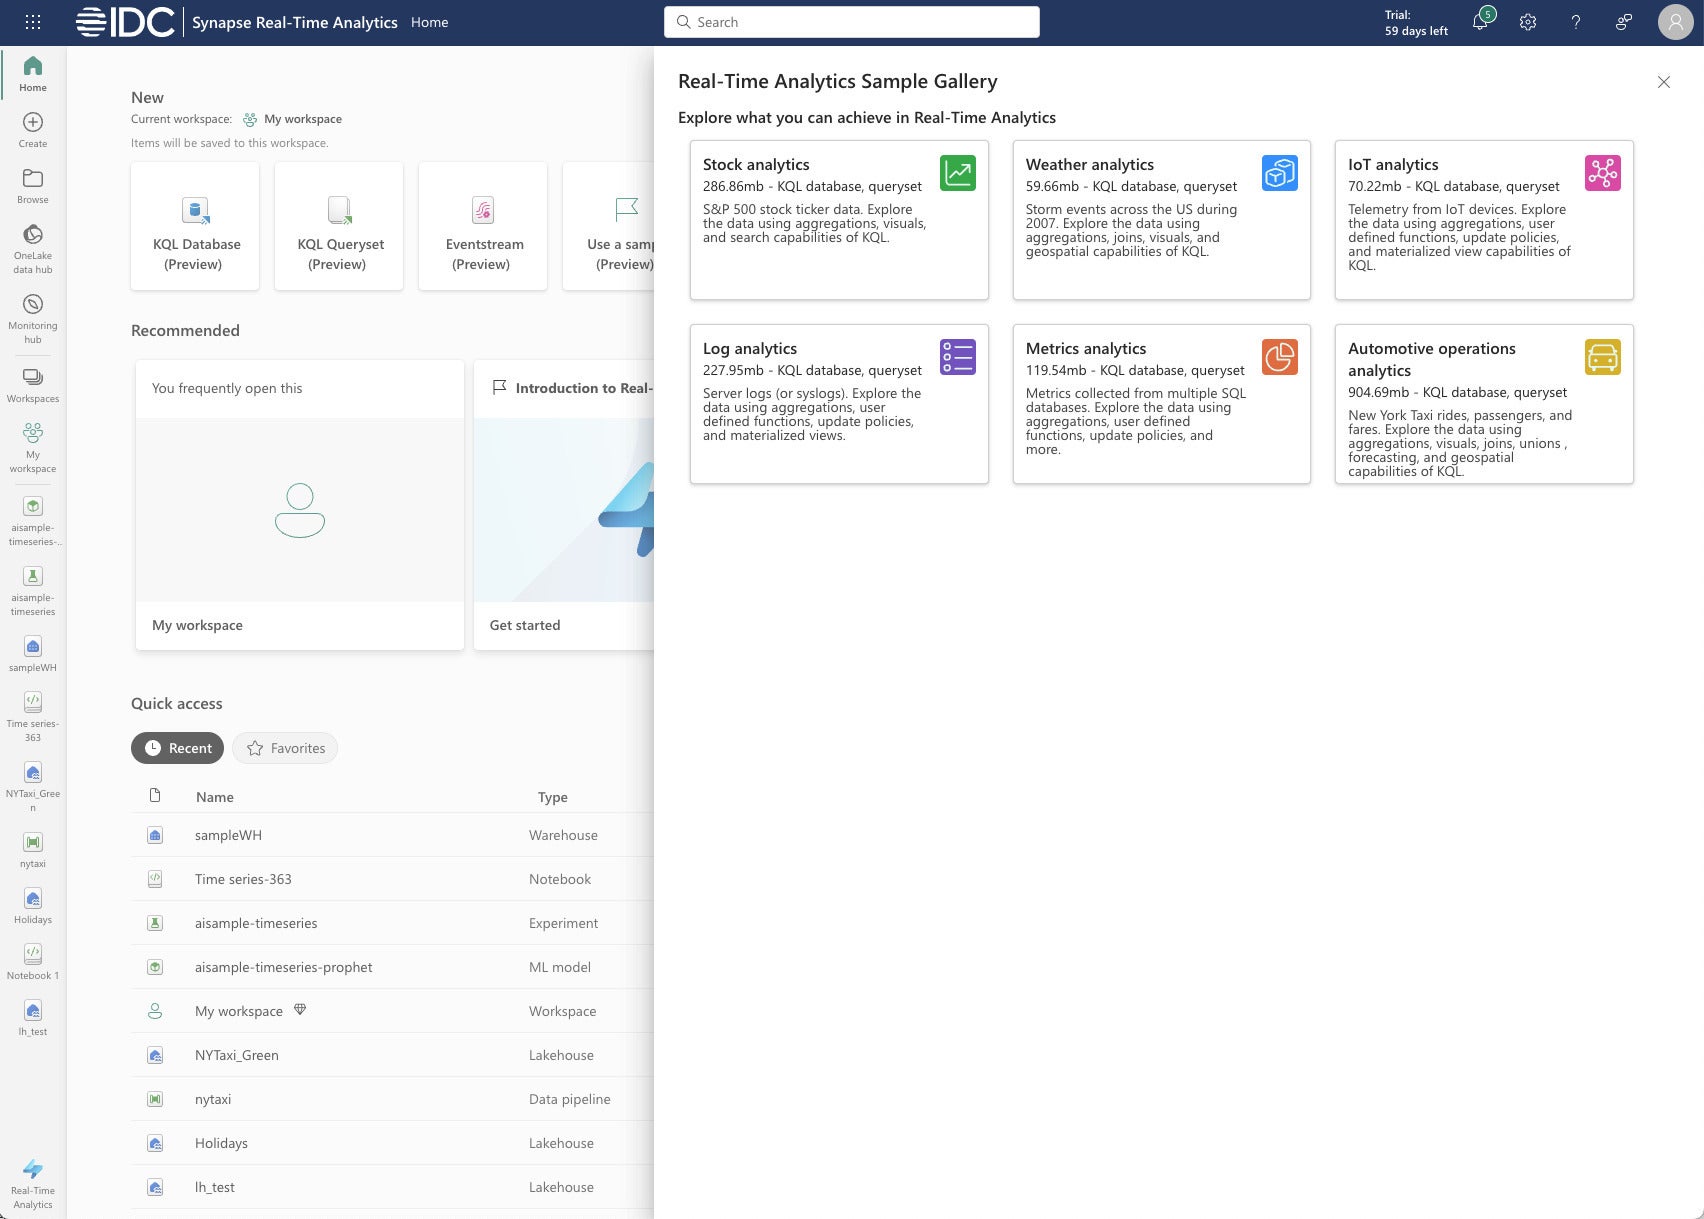 IDG
IDGThe Fabric Real-Time Analytics sample gallery currently offers half a dozen examples, with data sizes ranging from 60 MB for weather analytics to almost 1 GB for New York taxi rides.
The KQL query for the screenshot below is interesting because it uses geospatial functions and renders a scatter chart.
//We can perform Geospatial analytics with powerful inbuilt functions in KQL
//Plot storm events that happened along the south coast
let southCoast = dynamic({"type":"LineString","coordinates":[[-97.18505859374999,25.997549919572112],[-97.58056640625,26.96124577052697],[-97.119140625,27.955591004642553],[-94.04296874999999,29.726222319395504],[-92.98828125,29.82158272057499],[-89.18701171875,29.11377539511439],[-89.384765625,30.315987718557867],[-87.5830078125,30.221101852485987],[-86.484375,30.4297295750316],[-85.1220703125,29.6880527498568],[-84.00146484374999,30.14512718337613],[-82.6611328125,28.806173508854776],[-82.81494140625,28.033197847676377],[-82.177734375,26.52956523826758],[-80.9912109375,25.20494115356912]]});
StormEvents
| project BeginLon, BeginLat, EventType
| where geo_distance_point_to_line(BeginLon, BeginLat, southCoast) < 5000
| render scatterchart with (kind=map)
//Observation: Because these areas are near the coast, most of the events are Marine Thunderstorm Winds
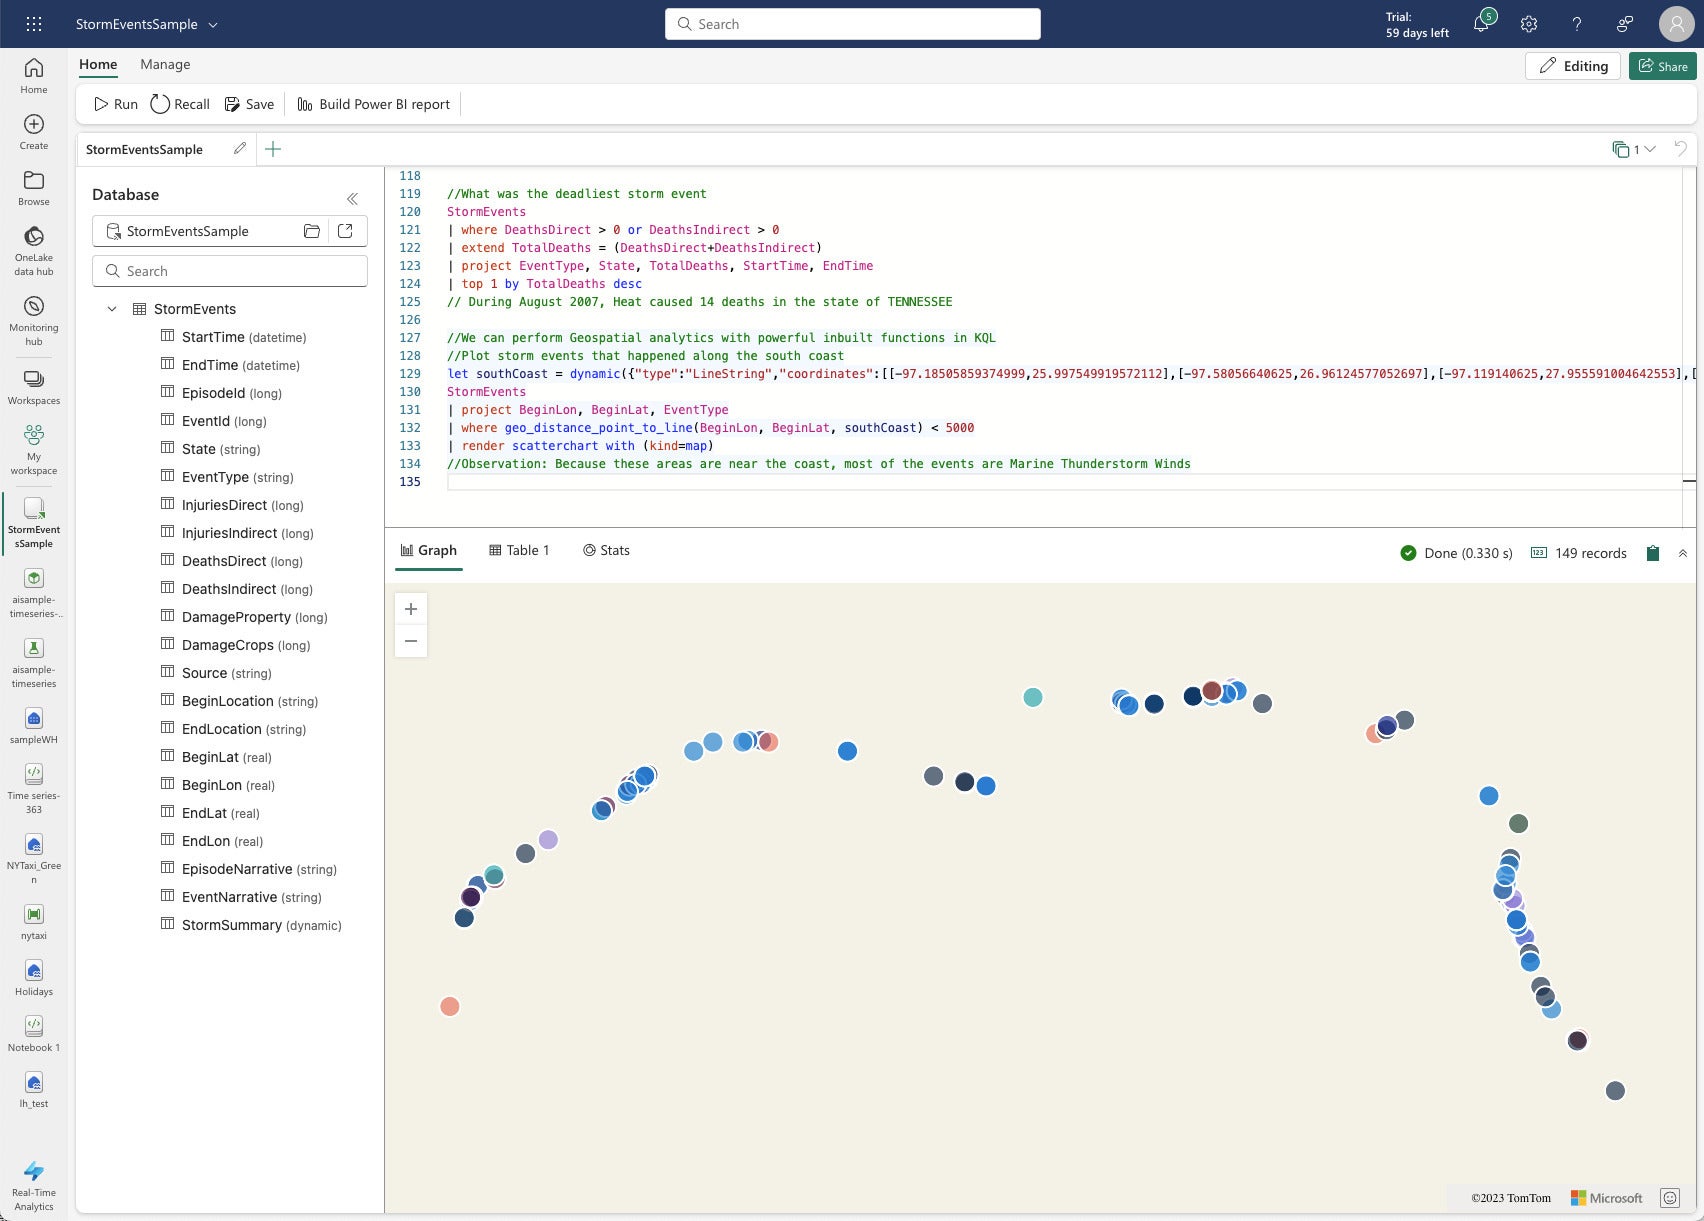 IDG
IDGDespite having 60 MB of data, this geospatial KQL query ran in a third of a second.
Broad scope and deep analytics
While I discovered numerous bugs while exploring the preview of Microsoft Fabric, I also got a good idea of its broad scope and deep analytic capabilities. When it is fully shaken down and fleshed out, it might well compete with Google Cloud Dataplex.
Is Microsoft Fabric really appropriate for everybody? I have no idea. But I can say Fabric does a good job of allowing you to view just your area of current interest with the view switcher in the bottom left corner of the interface, which reminds me of the way Adobe Photoshop serves its various audiences (photographers, retouchers, artists and so on). Unfortunately, Photoshop has the well-earned reputation of not only having a lot of power, but being a bear to learn. Whether Fabric will develop a similar reputation remains to be seen.
Copyright © 2024 IDG Communications, Inc.


